The home for great
culture
culture
Publish on Substack and own your work
1

Sociologist and author Anna Akbari applies real-world sociology to modern life and personal development. Every month, a new theme is approached from a sociological angle, leaving subscribers to explore thoughtful observations which inspire their lives.
Launched 3 months ago · $5/month
2

Zeteo is a new media organization that seeks to answer the questions that really matter, while always striving for the truth. Founded by Mehdi Hasan, Zeteo is a movement for media accountability, unfiltered news and bold opinions.
Tens of thousands of paid subscribers · $8/month
3

British writer and mother Liv Purvis delivers a lifestyle newsletter rooted in nostalgia while sharing what’s good and special now.
Hundreds of paid subscribers · £5/month
4

Subscribe for deep dives and research-based analysis on trading ideas, risk management and all things stocks from an independent investment researcher and investor.
Launched 2 years ago
5

Welcome to The Recovering Line Cook, a weekly newsletter featuring food writing, essays, and recipes from former restaurant cook Wil Reidie. Subscribe for stories, restaurant cooking tips, and Wil’s favourite recipes.
Launched a year ago · $5/month
Creating a new media ecosystem
You made it, you own it.
You always own your intellectual property, mailing list, and subscriber payments. With full editorial control and no gatekeepers, you can do the work you most believe in.
Create your Substack

Grow your audience.
Marketing isn’t all on your shoulders. More than 50% of all new free subscriptions and 25% of paid subscriptions to Substacks come from within our network.
Create your Substack

Let us handle everything else.
A Substack combines a website, blog, podcast, video tools, payment system, and customer support team — all integrated seamlessly in a simple interface. We handle the admin, billing, and tech so you can focus on making your best work.
Create your Substack
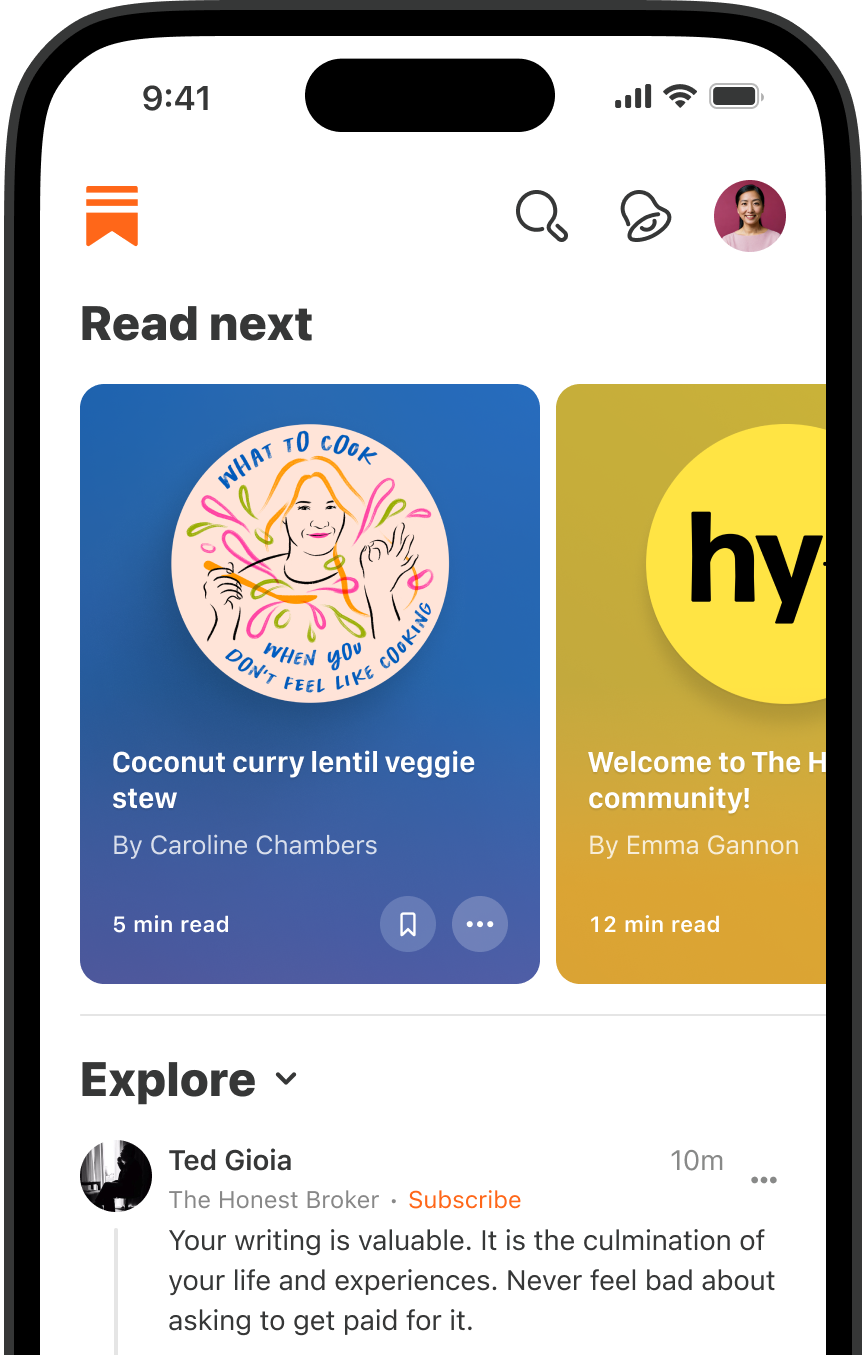
A world-class reading, watching, and listening experience
We make it easy to start a podcast—including video podcasts—, and produce voiceovers and narrations for your text posts. Share episodes to Substack subscribers and to all the major podcast players with one click.You can make your show free to everyone or you can use a paywall for: the whole podcast; select episodes; or at any point in a particular episode.
Create your Substack
Create a video post, or upload or record videos directly into a post. You can also turn your videos into a podcast, make videos available to everyone, or use a paywall for a whole or part of a video.
Create your Substack
On Substack, you’re not publishing into a void. Comments, Chat, Notes, direct messaging, and community threads connect you and your subscribers directly.
Create your Substack
“Starting a Substack was the best decision of my life.“
– Edwin Dorsey, The Bear Cave
Substack basics
What is a Substack?
Substack is much more than a newsletter platform. A Substack is an all-encompassing publication that accommodates text, video, audio, and video.. No tech knowledge is required. Anyone can start a Substack and publish posts directly to subscribers’ inboxes—in email and in the Substack app. Without ads or gatekeepers in the way, you can sustain a direct relationship with your audience and retain full control over your creative work.
Do I need to pay for Substack?
It’s free to get started on Substack. If you turn on paid subscriptions, Substack will keep a 10% cut of revenues for operating costs like building growth tools to help publishers, developing new features, and providing world-class customer support. There are no hidden fees and we only make money when publishers do.
Do I own what I publish on Substack?
You will always own your work, everything you publish, and your relationships with your subscribers. We make it easy to import and export your archive, subscriber list, and payments information to and from other platforms.
Will Substack help me grow my audience?
Yes. More than 50% of all new free subscriptions and 25% of paid subscriptions to Substacks come from within our network.
How do I move my past work to Substack?
If you already have an audience on Wordpress, Mailchimp, Beehiiv, Ghost, Medium, Tumblr, or another platform, you can easily import your posts and your email list in the Substack setup process.